How to Fix AI Agent Latency Bottlenecks
AI agent latency bottlenecks happen when large language models process redundant tool calls and heavy system prompts on every turn. You can fix this issue by implementing prompt caching, optimizing context windows, and utilizing async token streaming for instant feedback.

Understanding AI Agent Latency Bottlenecks
AI agent latency bottlenecks occur when automated systems take too long to return text or execute tool calls. Modern multi-step AI agents frequently query remote APIs, parse JSON payloads, and re-read massive system instructions. When token count grows, inference times spike, and user experience degrades quickly. Developers often blame the core model provider when the real issue is poor context management and redundant token transmission.
Running complex agent loops requires careful tracking of how data moves through your system. Every time an agent asks for file access or database queries, it sends the full chat history back to the model. This creates a compounding delay that slows down every subsequent task. To solve this, you must analyze your network traces and pinpoint exactly where token processing stalls out.
In a typical B2B customer support workflow, an AI agent might need to verify user subscriptions, check shipping databases, and generate a polite reply. If each step takes three seconds, the total wait time frustrates the user and drives down platform adoption.
Developers can test different model configurations to see how speed changes under load. Comparing performance metrics helps teams choose the right balance between deep reasoning and fast execution. For insights on model speed trade-offs, read our guide on OpenAI o3 vs Claude 3.5 Sonnet: Developer Benchmarks.
To build a faster agent, start by mapping every network hop between your application server and the LLM provider. Identify redundant loops where the agent calls the same tool twice due to poor memory state retention.
Root Cause Analysis of Slow Agent Responses
Poor prompt architecture is the number one driver of slow AI agent responses in production applications. Developers often stuff thousands of words of instructions into the system prompt for every single request. The large language model must process this static block of text before generating a single new token. This wastes computing power and delays the first byte of output.
Another major root cause is synchronous tool execution during multi-step planning phases. If your agent waits for three sequential API calls to finish one by one, your user sits waiting for ten seconds. Network overhead and database lockups add more friction to the execution chain. You need to isolate these bottlenecks using profilers and application performance monitoring tools.
Consider a sales intelligence agent that scrapes company data, analyzes financial reports, and drafts outreach emails. If these tools run in a strict, unoptimized queue, latency balloons instantly.
Common Pitfalls to Avoid in Prompt Design
- Hardcoding massive static reference documents directly into every user request payload.
- Forgetting to strip out verbose XML or JSON tags that inflate token counts unnecessarily.
- Relying on synchronous database queries inside the agent reasoning loop without timeouts.
- Failing to implement fallback models when primary inference providers experience high load.
Optimizing your prompt structure also ensures your system operates smoothly without hitting strict rate limits. For more advanced workflow tips, check out our AI Prompt Studio & Optimizer to refine your system instructions.
Step 1: Implement Prompt Caching for Static System Instructions
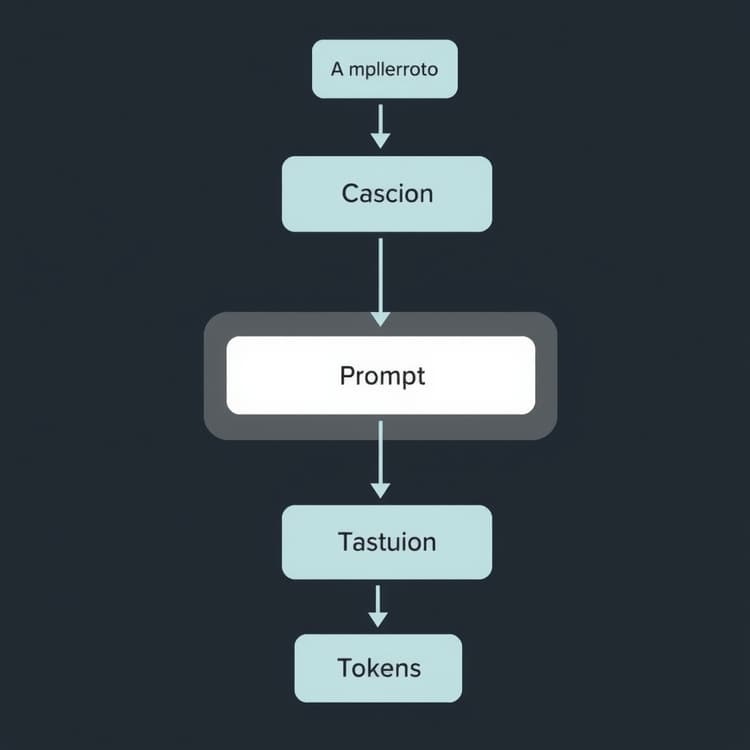
Prompt caching lets you store large system prompts and reference materials in memory on the server side. When your AI agent makes a request, the provider reuses the cached tokens instantly without recalculating them. This cuts time-to-first-token down by up to eighty percent for long instruction sets.
To apply this fix, tag your static system messages and reference docs with cache control headers supported by your API provider. Keep your dynamic user inputs separate from your static knowledge base so the cache hit rate stays high. Monitor your provider dashboard to ensure your cache retention window matches your traffic patterns.
Step-by-Step Prompt Caching Workflow
- Audit your current system prompts to separate static compliance rules from dynamic user inputs.
- Structure your API payload so the static instruction block appears at the very beginning.
- Add provider-specific cache control parameters to the system message object in your code.
- Test cache hit ratios in a staging environment before pushing updates to production traffic.
- Track cost savings on your monthly invoice as input token charges drop significantly.
| Strategy | Traditional Execution | Cached Approach | Latency Reduction |
|---|---|---|---|
| System Prompts | Reprocessed every turn | Stored in server memory | Up to 80% faster |
| Tool Definitions | Sent with every payload | Registered once at startup | 40% less overhead |
| Context Windows | Full history re-read | Incremental updates | 50% lower compute |
Step 2: Switch to Async Token Streaming and Parallel Tool Calls
Streaming tokens to the user interface changes the perception of speed in modern applications. Instead of waiting for the entire response to finish, users see words appear on screen immediately. You should configure your agent backend to use Server-Sent Events for real-time text rendering.
Furthermore, update your agent logic to execute independent tool calls in parallel rather than sequentially. If an agent needs to fetch weather data and check user permissions at the same time, fire both requests simultaneously. This simple architectural change turns multi-second delays into single-turn responses.
Implementing Parallel Tool Execution
- Analyze your agent execution graph to find independent tool dependencies.
- Replace synchronous
awaitchains with asynchronousPromise.allblocks in Node.js orasyncio.gatherin Python. - Implement strict execution timeouts on every tool call to prevent hanging worker threads.
- Return structured JSON responses from tools to speed up secondary parsing cycles.
Testing these adjustments requires a clear view of your operational expenses and team output. You can evaluate your workflow improvements using our AI ROI & Productivity Calculator for Small Business.
Step 3: Trim Redundant Context and Implement Semantic Summarization
As chat histories grow, AI agent latency climbs because the model re-reads obsolete dialogue turns. You can fix this by writing a background summarization routine that condenses past chat history every five turns. Keep only the recent messages and a short summary of earlier decisions in the active context window.
Semantic filtering also stops agents from passing unnecessary file attachments or logs into every prompt. Only include the specific code snippets or data rows that the agent needs for the current task. Smaller payloads mean faster token generation and lower API bills.
Clean context windows prevent the model from getting confused by old instructions or stale data. Regular pruning keeps your agent smart, fast, and cost-effective over long sessions.
Practical Context Pruning Workflow
- Set a hard token limit threshold for active agent threads, such as four thousand tokens.
- Trigger a background LLM summarization task whenever the active thread exceeds this threshold.
- Replace old message arrays with a single compressed summary block in the database.
- Log token reduction metrics to verify that your memory management routine works correctly.
Investing time in semantic pruning yields immediate financial returns. Reducing input token size by fifty percent cuts your infrastructure and API run costs in half instantly.
Step 4: Monitor Production Metrics and Set Up Rate Limit Alerts
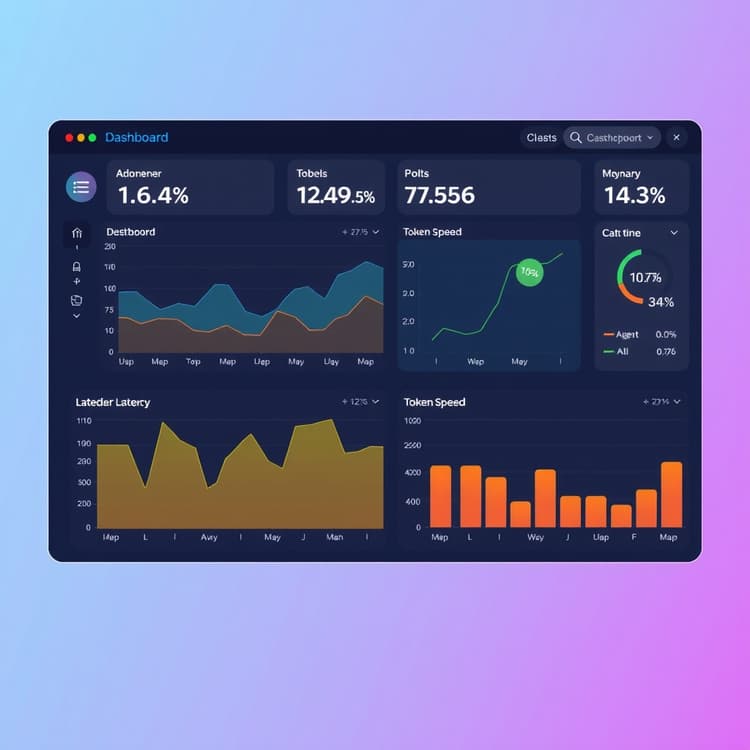
Production AI agents require continuous monitoring to catch performance regressions before users complain. Set up custom telemetry to track token generation speed, time-to-first-token, and tool execution failures. Use alerting tools to notify your engineering team if average agent latency exceeds two seconds.
Keep an eye on provider-side status pages and error rates to adjust your retry logic dynamically. If a primary model starts throttling requests, your system should gracefully fall back to a faster secondary model. Proactive monitoring ensures your AI agents stay reliable around the clock.
Essential Production Telemetry Checklist
- Track time-to-first-token metrics across every model and route in your application.
- Measure tool execution duration to spot slow third-party API dependencies.
- Configure webhook alerts in Slack or PagerDuty for sudden spikes in error rates.
- Review latency dashboards weekly to catch gradual performance degradation early.
Frequently Asked Questions
What causes high latency in AI agents?
High latency is usually caused by processing massive system prompts, re-reading long chat histories, and running sequential tool calls without caching.
How does prompt caching reduce AI agent latency?
Prompt caching stores static system instructions and reference data in server memory, allowing the model to skip reprocessing those tokens on every turn.
Should I run tool calls sequentially or in parallel?
You should run independent tool calls in parallel to eliminate unnecessary wait times and drastically speed up the agent response cycle.
Get the Weekly SMB AI & SaaS Brief
Practical software benchmarks, prompt templates, and ROI breakdowns delivered every Tuesday. No fluff, unsubscribe anytime.